Connector Grafana Dashboard
Using the monitoring capability of the Connector tango device, we have implemented a dashboard for Grafana in order to display the various attribute of the P4 switch. To do so, we are leveraging the ska-tango-archiver project to deploy EDA automatically and thus automatically store telemetry inside the timescaledb database.
In this page, we are going to go through the deployment of EDA alongside the connector, then how to configure EDA to record connector telemetry. Finally, we detail how the dashboard works.
Deployment
EDA configuration
In order to deploy EDA alongside the ska-low-cbf-conn helm it is fairly straightforward. First you need to add the following in the charts.yaml file
name: ska-tango-archiver
version: 2.6.0
repository: https://artefact.skao.int/repository/helm-internal
This would deploy the necessary pods but without any configuration. This configuration is added in the values.yaml file as follows:
ska-tango-archiver:
  hostname: 192.168.1.1
  dbname: ska_low_cbf
  dbuser: admin
  port: 5432
  dbpassword: ask_your_admin
  telescope: SKA-low
  telescope_environment: LOW-STFC
  archwizard-config: tango://tango-databaseds.ska-low-cbf-conn.svc.cluster.local:10000/low-eda/cm/01
In this configuration, obviously you need to put the correct values for everything related to the timescaledb database.
From there, the EDA should be deployed and you can access it on
url from the “minikube service configurator -n ska-low-cbf-conn –url” command if running in minikube
http://k8s-cluster-ip/ska-low-cbf-conn/configurator/configuration-page if deployed in a k8s cluster
In this previous page, you can now upload the EDA configuration yaml file that is available on the resource directory. This file contains all measurement points from the connector and their retrieval policy:
db: tango-databaseds.ska-low-cbf-conn.svc.cluster.local:10000
manager: low-eda/cm/01
archiver: low-eda/es/01
configuration:
- class: LowCbfConnector
    attributes:
    state:
        archive_period: 1000
        code_push_event: true
      healthState:
        archive_period: 1000
        code_push_event: true
      health_status:
        archive_period: 1000
        code_push_event: true
      port_rx_throughput:
        archive_period: 1000
        code_push_event: true
      port_tx_throughput:
        archive_period: 1000
        code_push_event: true
      port_rx_pps:
        archive_period: 1000
        code_push_event: true
      port_tx_pps:
        archive_period: 1000
        code_push_event: true
      basicroutingtable:
        archive_period: 10000
        polling_period: 5000
      multicastsessions:
        archive_period: 10000
        polling_period: 5000
      arproutingtable:
        archive_period: 10000
        polling_period: 5000
      speadunicastroutingtable:
        archive_period: 10000
        polling_period: 5000
      speadmultiplierroutingtable:
        archive_period: 10000
        polling_period: 5000
      psrroutingtable:
        archive_period: 10000
        polling_period: 5000
      sdpiproutingtable:
        archive_period: 10000
        polling_period: 5000
      sdpmacroutingtable:
        archive_period: 10000
        polling_period: 5000
Json dashboard import
Once the EDA is configured and the connector started, the database should start being populated. Prior to importing the dashboard, you need to make sure that you have configured the correct source in Grafana. Then you can import the json dashboard from the resource directory.
Connector Dashboard
The connector Grafana dashboard is a relatively simple dashboard consisting in three separate groups of panels grouped by functionality. These three groups are:
the overview of the switch and tango device
the routing tables details
live traffic
In the following sections we are detailing those different panels.
Overview panels
The first group of panels consists of a general overview of both the tango device and the switch ports.
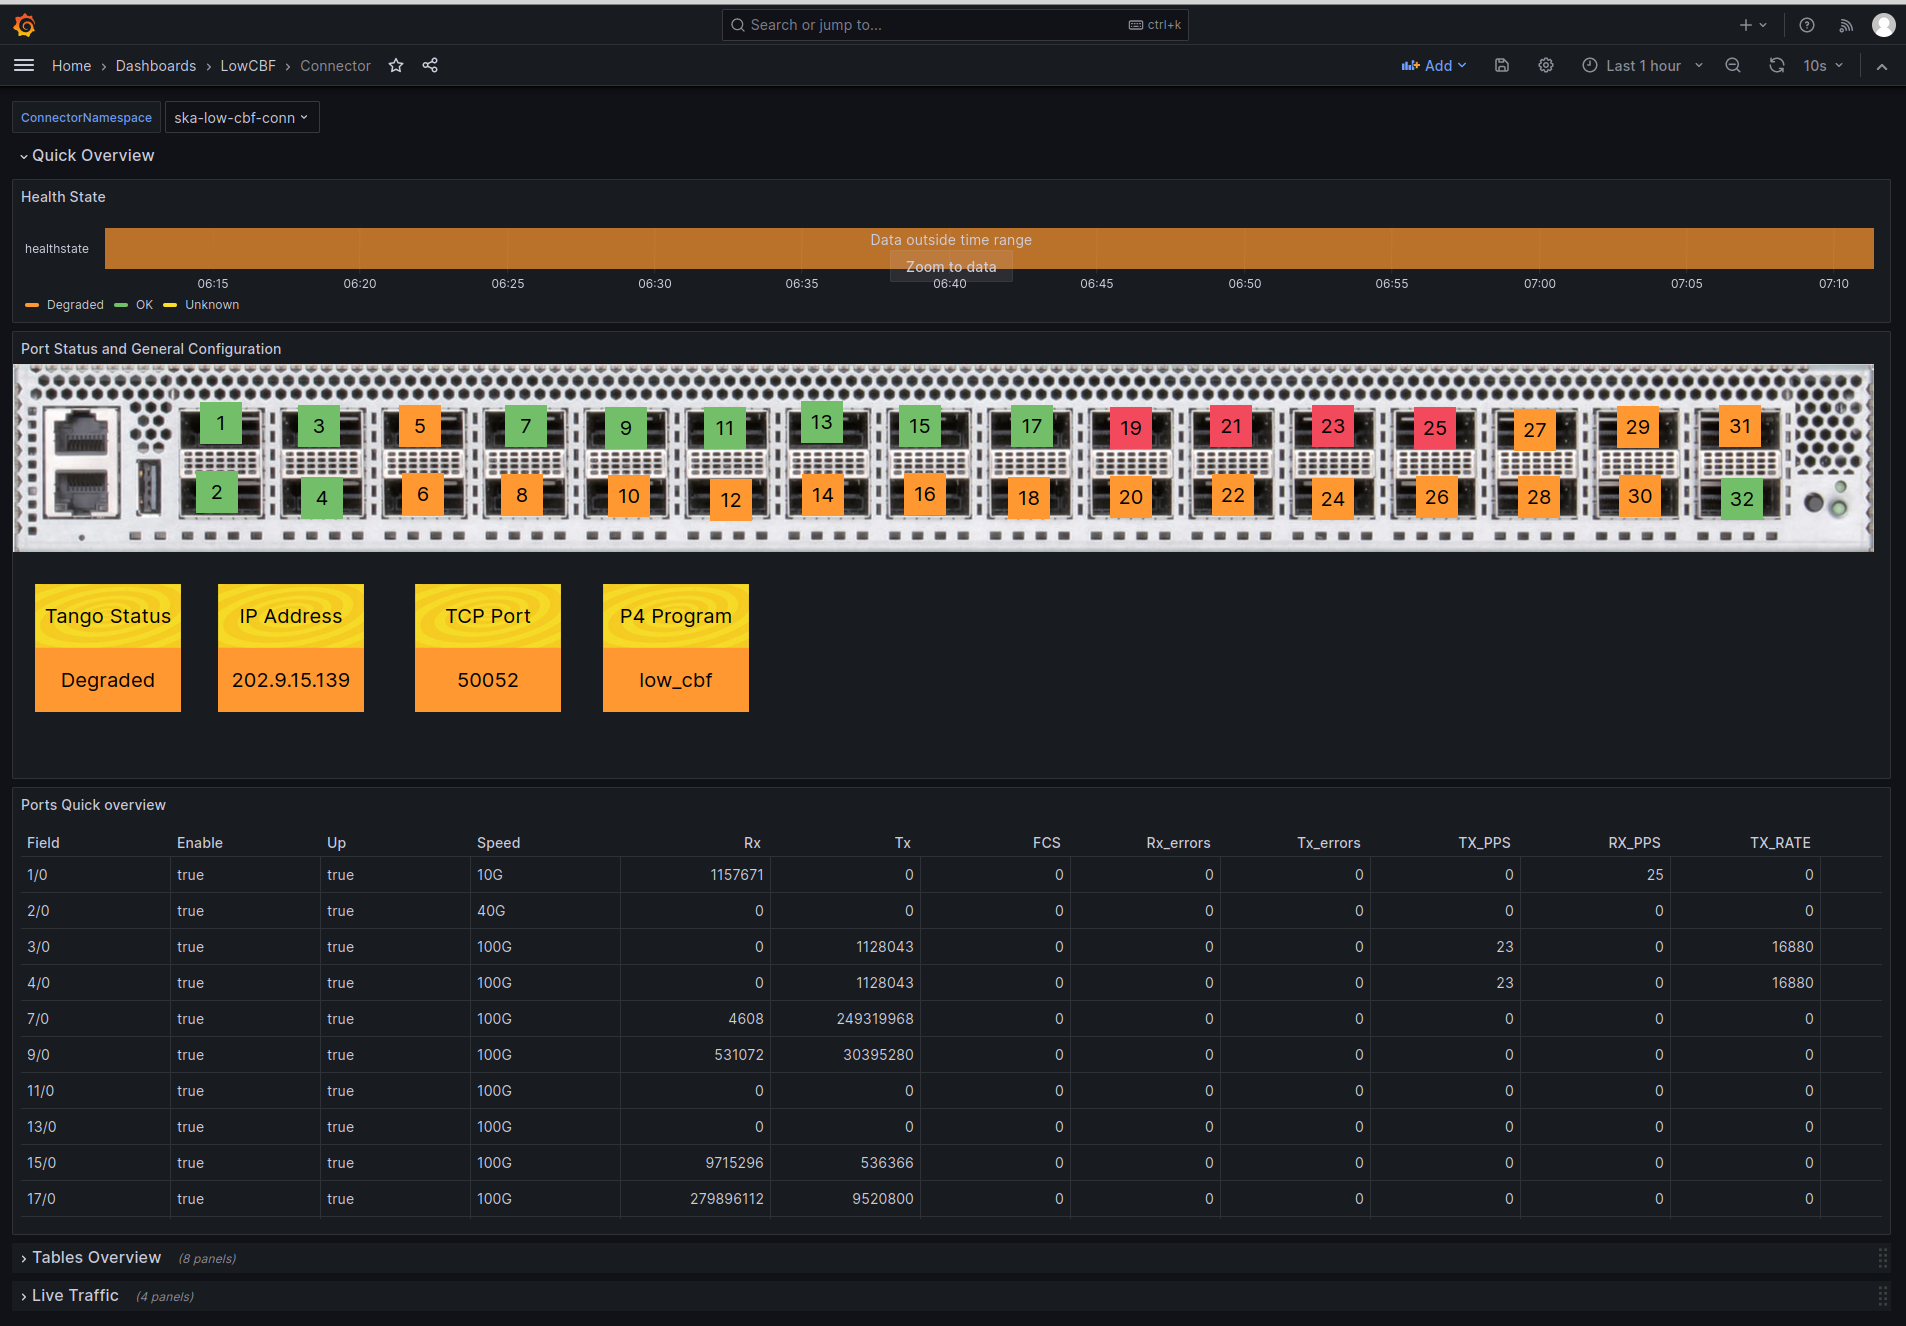
In those panel we can see from top to bottom:
the timeline of the tango health state. This state can have 4 different values
Ok: when all configured ports are Up and Enable
Degraded: when at least one port is either down or disable
Fault: when a fault occurred in the tango device
Unknown: usually before the tango device is connected to the switch agent
port overview and general tango configuration
first with a graphical representation of the switch and the port status
various parameter of the tango device such as the IP of the switch or the program name
port overview with a more detailed yet comprehensive overview of each logical switch port
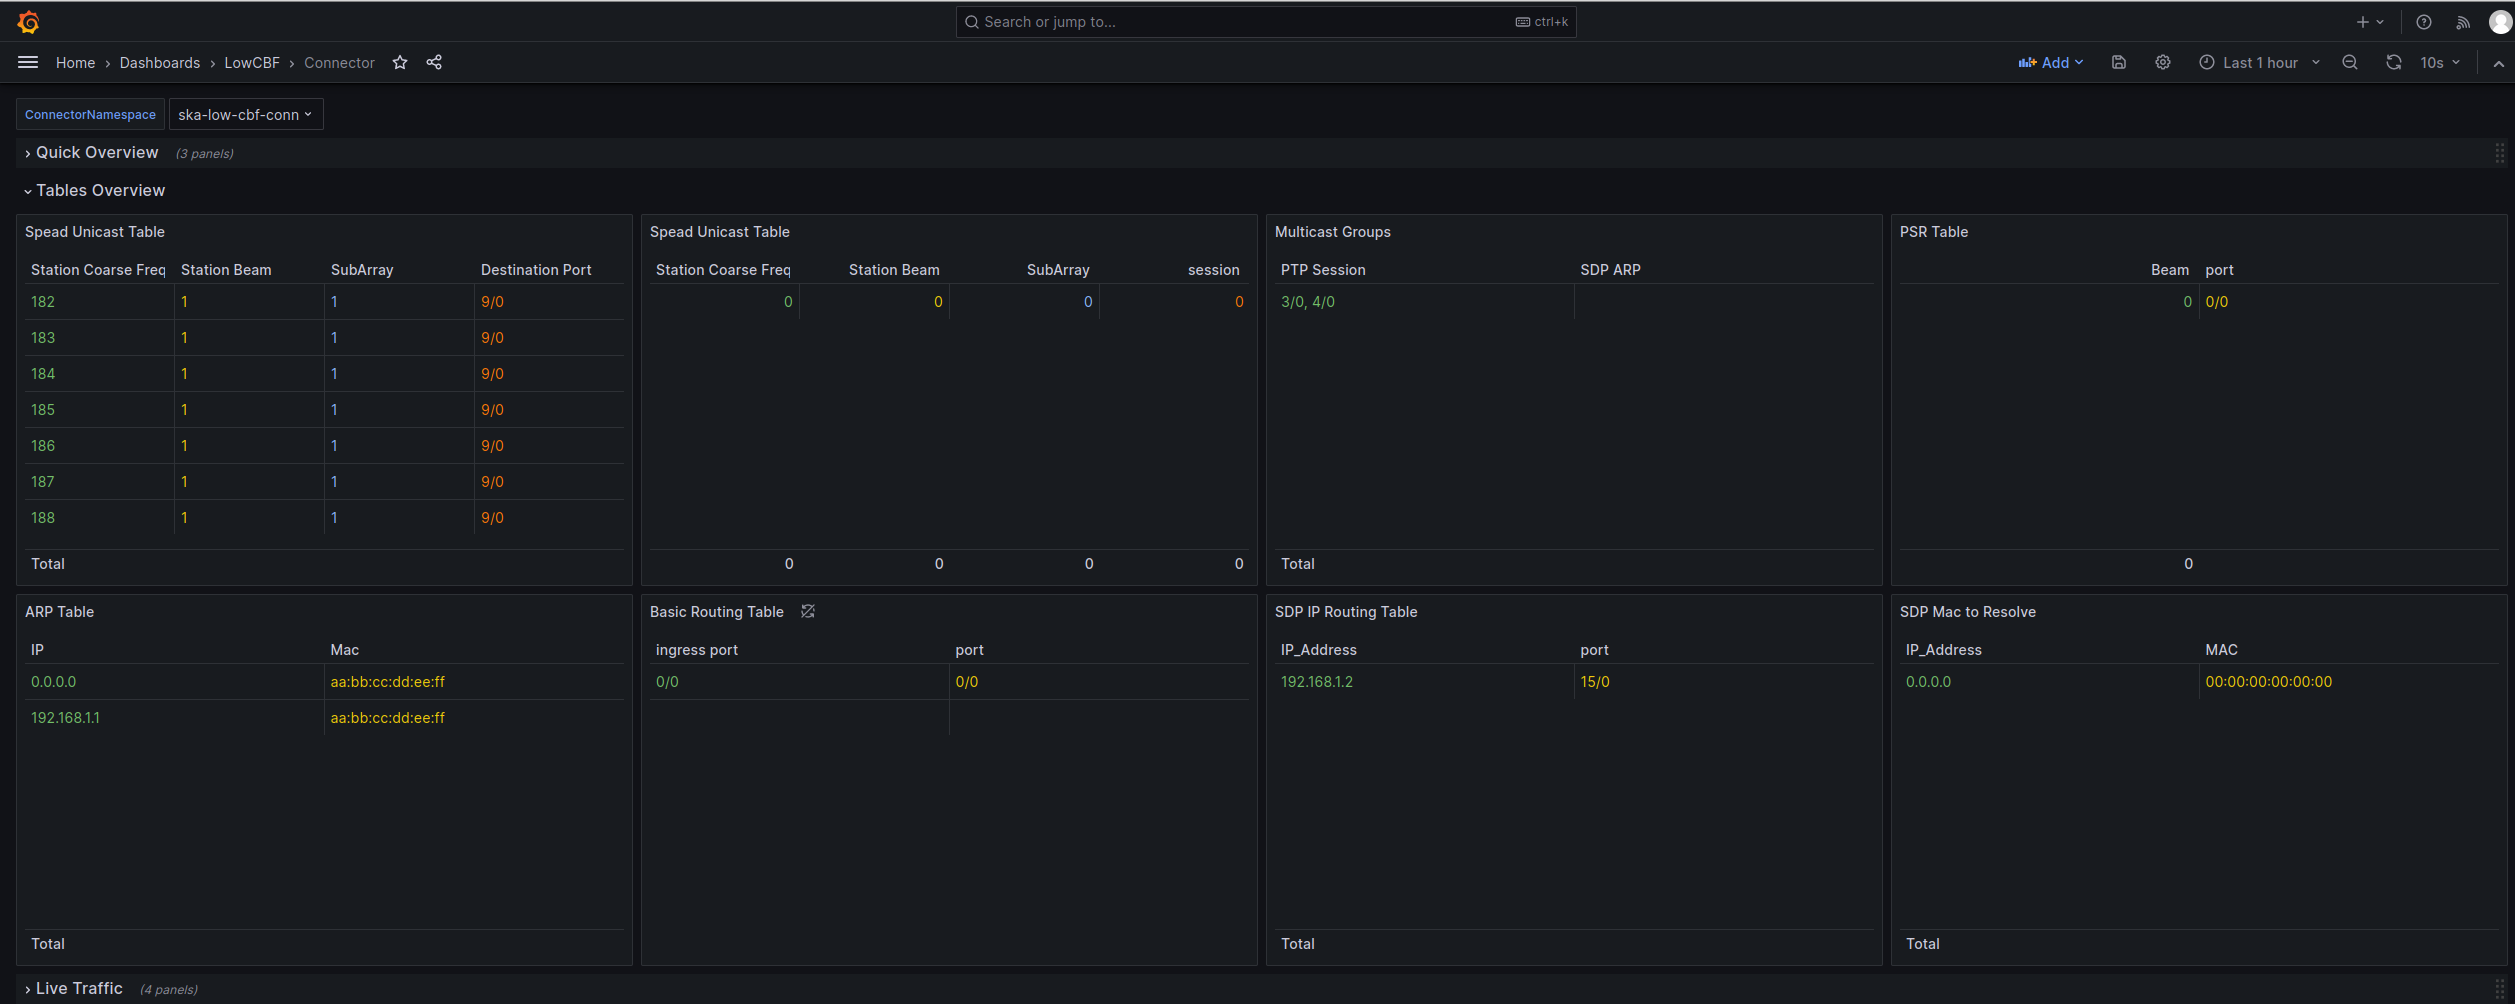
Tables panels
The second group of panels consists of a list of all tables on the switch.
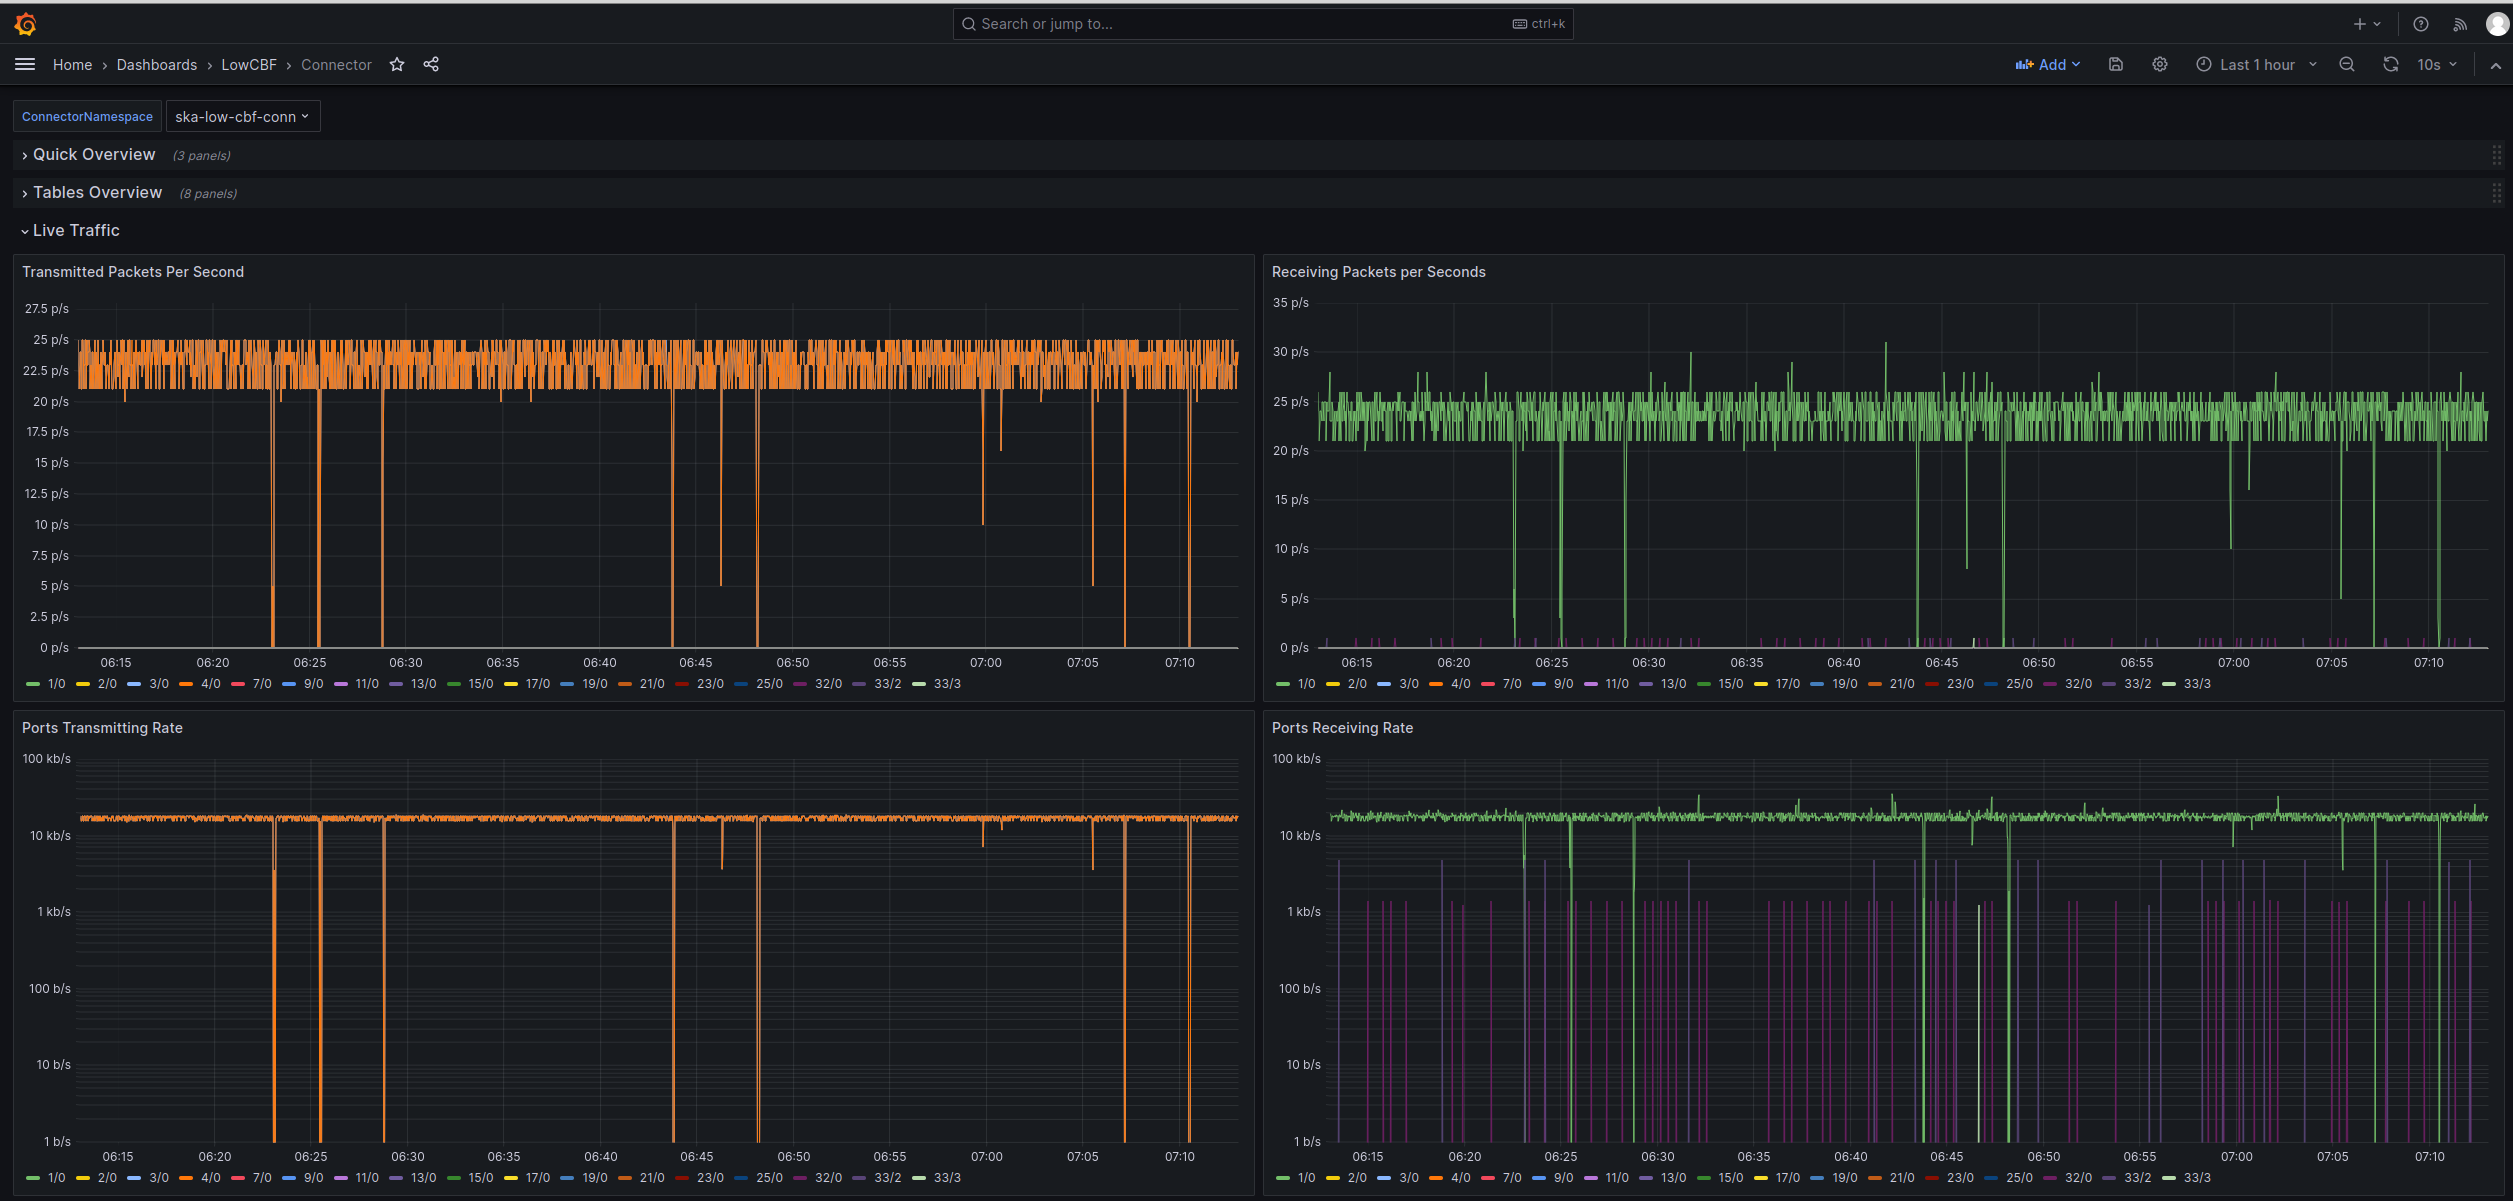
Traffic panels
The final group of panels consists of four panel displaying the traffic seen in the last 2 hours in all ports in the switch.